
Back in December, the NBA world was bombarded with content about the team of the decade, like it’s somehow profound to decide that LeBron James, Steph Curry, and Kevin Durant are in fact worthy of that distinction. Great, that’s cool, and I’ve read them all despite redundancy. But what about the guys who worked their ass off all decade long and never made it to the All-Star Game? They’re the real heroes, holding the Association together while the stars tear it apart.
Now I’m not planning on taking this position by position, because if one thing was obvious about the 2010’s, it was the revelation and integration of position-less basketball. Back when I was young, John Stockton brought the ball up every damn possession for the Jazz. If you port that team into 2019, Karl Malone and Blue Edwards are definitely running point for some reason. It does look goofy, but it also opens up possibilities that were once, for some reason, taboo in the game. Players are faster and stronger than ever before, and despite height disparity, many bigs can dribble and many little guys can post up.
My main metric class will be stats per 100 possessions, a defining point to assessing the value of a player on a large and small scale. All players will have had to complete at least four (4) full seasons, or 328 games between October 2009 and April 2019. As always, major kudos to the greatest site in the galaxy- Sports-Reference.com for all of this glorious data.
So in lieu of what I said about position-less basketball above, the basic divisions of guard and forward are rather important. In order to give smaller guys and bigger guys their equal respect, I will designate two guards and three forwards per team, with exceptions given for guys who play pretty much everything- think Kawhi Leonard, but then again you won’t be hearing from him as we move on.
First up is the guards. If we take the archetype point guards of the era- Curry (3PM), Chris Paul (Steals), and Russell Westbrook (Rebounds), we’ll notice each one is a distinct outlier in one particular category. Of course, all three, plus their spiritual brother James Harden, were multiple all-stars. Using them as a guideline for what mattered in the era is a nice way to gauge a player’s value.
So let’s start with three-pointers. Never before has the long ball, and not just at the line but often several feet back, been such an important part of the sport. The floor gets spread out nearly to mid-court, which opens up play up in the paint. The weaponry displayed by modern guards is absurd, even in a forward-driven league.
| Crit | Crit | Crit | Per | Per | ||||
|---|---|---|---|---|---|---|---|---|
| Rk | Player | From | To | G | 3PA | 3P% | 3P ▼ |
3PA |
| 1 | J.J. Redick | 2010 | 2019 | 696 | 5.5 | .415 | 4.1 | 9.8 |
| 2 | Eric Gordon | 2010 | 2019 | 551 | 6.5 | .372 | 3.7 | 10.0 |
| 3 | J.R. Smith | 2010 | 2019 | 622 | 5.7 | .372 | 3.7 | 9.9 |
| 4 | Tim Hardaway | 2014 | 2019 | 403 | 5.4 | .343 | 3.5 | 10.3 |
| 5 | Wesley Matthews | 2010 | 2019 | 724 | 5.6 | .382 | 3.4 | 8.9 |
| 6 | CJ McCollum | 2014 | 2019 | 411 | 5.0 | .401 | 3.3 | 8.3 |
Of the guards to take at least 5 threes per game, only six fit our original criteria. None of them should be a surprise, as they’re all well known for their role-playing capabilities. Per 100 possessions, J.J. Redick was the most prolific of the group, culling over 12 points solely on threes. Take a look at CJ McCollum though. Despite shooting just at the fringe of exactly 5 threes per game, his percentage is right behind Redick’s. Still, if we need a shooter in the back court, its hard to argue against J.J.’s production.
| Crit | Crit | Crit | Crit | ||||
|---|---|---|---|---|---|---|---|
| Rk | Player | From | To | G | TOV | STL | STL ▼ |
| 1 | Monta Ellis | 2010 | 2017 | 601 | 4.0 | 2.5 | 1082 |
| 2 | Mike Conley | 2010 | 2019 | 653 | 3.2 | 2.5 | 1027 |
| 3 | Tony Allen | 2010 | 2018 | 538 | 2.9 | 3.6 | 866 |
| 4 | Darren Collison | 2010 | 2019 | 708 | 3.3 | 2.0 | 819 |
| 5 | Mario Chalmers | 2010 | 2018 | 564 | 3.7 | 2.8 | 790 |
| 6 | Thabo Sefolosha | 2010 | 2019 | 622 | 1.8 | 2.5 | 742 |
| 7 | Raymond Felton | 2010 | 2019 | 652 | 3.4 | 2.1 | 702 |
| 8 | J.R. Smith | 2010 | 2019 | 622 | 2.3 | 2.0 | 692 |
| 9 | Brandon Jennings | 2010 | 2018 | 555 | 3.7 | 2.1 | 679 |
| 10 | Ty Lawson | 2010 | 2017 | 551 | 3.6 | 2.0 | 636 |
We can see that by sorting by total steals, an almost entirely different group shows up. I added a category for turnovers per 100 possessions, because I feel like if we’re going to discuss a player’s ability to take the ball away, we should note how much they give it away as well. The real outliers when that is considered are Allen, Sefolosha, and Smith, our only returning player. Thabo Sefolosha shows up because he played primarily shooting guard for the first five seasons of the decade. Tony Allen and J.R. Smith each had one season not primarily at a guard position.
Then of course, there are Monta Ellis and Mike Conley. The latter, by virtue of playing the entire decade, had more opportunities for total steals, but still fell short of Ellis. The important thing to factor in to Conley’s consideration is how he broke 1,000 steals for the decade but only turned the ball over 3.2 times per 100P. If we were to drop the criteria for threes to 4 per game, Conley is included on the prior chart, dramatically leading the pack when sorted by steals.
| Crit | Crit | Crit | ||||
|---|---|---|---|---|---|---|
| Rk | Player | From | To | G | 3PA | STL |
| 1 | Mike Conley | 2010 | 2019 | 653 | 4.0 | 1027 |
| 2 | Wesley Matthews | 2010 | 2019 | 724 | 5.6 | 790 |
| 3 | J.R. Smith | 2010 | 2019 | 622 | 5.7 | 692 |
| 4 | Brandon Jennings | 2010 | 2018 | 555 | 4.8 | 679 |
| 5 | Lou Williams | 2010 | 2019 | 684 | 4.6 | 641 |
Then of course, there’s the peculiar stat of rebounds by a primary guard. Over the last few years, we’ve grown accustomed to players like Russell Westbrook and now Luca Doncic padding their resumes but snaring rebounds from players who could do it more easily.
| Crit | Crit | Crit | Per | Per | ||||
|---|---|---|---|---|---|---|---|---|
| Rk | Player | From | To | G | TRB | TRB | ORB | DRB |
| 1 | Evan Turner | 2011 | 2019 | 686 | 8.8 | 3240 | 1.0 | 7.7 |
| 2 | Thabo Sefolosha | 2010 | 2019 | 622 | 8.5 | 2509 | 1.6 | 7.0 |
| 3 | Tony Allen | 2010 | 2018 | 538 | 8.9 | 2156 | 3.3 | 5.5 |
| 4 | Lance Stephenson | 2011 | 2019 | 508 | 9.1 | 2124 | 1.4 | 7.7 |
| 5 | Jeremy Lamb | 2013 | 2019 | 435 | 8.8 | 1588 | 1.3 | 7.6 |
I left the division of offensive and defensive rebounds per 100P for perspective. Where everyone is lingering in the 7 defensive boards area, Tony Allen is there, throwing his body into the more difficult scrum of snaring offensive ones. He has OVER TWICE AS MANY offensive rebounds per 100P as the next best guy. It makes his second place finish in overall rebounds per 100P that much more impressive.
For me, the names that are set apart in this discussion are Mike Conley, Tony Allen, J.R. Smith, J.J. Redick, Thabo Sefolosha, and I’ll qualify Wesley Matthews for sliding in on a few different boards above.
A major problem with evaluating players by statistics is that in theory a statistic can tell whatever you want it to tell.

I could find a stat that basically proves Player X was the best of the decade, but what really matters is when taken as a whole, how valuable was that particular player? Baseball has WAR, Wins Above Replacement, as a universal metric for evaluation. It’s not perfect, but its about as close to perfect as we can get in the year of our lord 2019.
Basketball has VORP, or Value Over Replacement Player as its “kitchen sink” stat. Once we sort just by that, a few new names appear who were not featured above.
| Crit | Crit | Crit | Tota | Tota | ||||||
|---|---|---|---|---|---|---|---|---|---|---|
| Rk | Player | From | To | Tm | Lg | G | VORP ▼ |
TRB | GS | MP |
| 1 | Mike Conley | 2010 | 2019 | MEM | NBA | 653 | 24.9 | 1912 | 651 | 21811 |
| 2 | Danny Green | 2010 | 2019 | TOT | NBA | 620 | 19.9 | 2169 | 544 | 15769 |
| 3 | George Hill | 2010 | 2019 | TOT | NBA | 649 | 18.9 | 2095 | 440 | 19201 |
| 4 | Wesley Matthews | 2010 | 2019 | TOT | NBA | 724 | 17.4 | 2240 | 662 | 23579 |
| 5 | Eric Bledsoe | 2011 | 2019 | TOT | NBA | 570 | 16.8 | 2229 | 408 | 15903 |
| 6 | Thabo Sefolosha | 2010 | 2019 | TOT | NBA | 622 | 13.5 | 2509 | 413 | 14869 |
| 7 | Tyreke Evans | 2010 | 2019 | TOT | NBA | 594 | 12.6 | 2720 | 426 | 18242 |
| 8 | Ricky Rubio | 2012 | 2019 | TOT | NBA | 498 | 12.3 | 2092 | 477 | 15370 |
| 9 | Lou Williams | 2010 | 2019 | TOT | NBA | 684 | 11.8 | 1637 | 110 | 18404 |
| 10 | Tony Allen | 2010 | 2018 | TOT | NBA | 538 | 11.7 | 2156 | 367 | 12750 |
| 11 | Darren Collison | 2010 | 2019 | TOT | NBA | 708 | 11.1 | 1885 | 518 | 20796 |
| 12 | J.R. Smith | 2010 | 2019 | TOT | NBA | 622 | 11.0 | 2214 | 272 | 18211 |
| 13 | J.J. Redick | 2010 | 2019 | TOT | NBA | 696 | 10.9 | 1504 | 447 | 19651 |
| 14 | Ty Lawson | 2010 | 2017 | TOT | NBA | 551 | 10.9 | 1506 | 344 | 16088 |
| 15 | Vince Carter | 2010 | 2019 | TOT | NBA | 704 | 10.6 | 2239 | 213 | 16220 |
While Conley is the clear A1 option, Danny Green and George Hill make their case. Lets look at their stats, primarily in those areas we focused on earlier.
| Crit | Crit | Per | Per | Per | Per | Per | Per | Per | ||||
|---|---|---|---|---|---|---|---|---|---|---|---|---|
| Rk | Player | From | To | G | VORP | 3P | 3PA | ORB | DRB | TRB | STL | TOV |
| 2 | Danny Green | 2010 | 2019 | 620 | 19.9 | 3.7 | 9.2 | 1.2 | 5.8 | 7.0 | 2.0 | 2.1 |
| 3 | George Hill | 2010 | 2019 | 649 | 18.9 | 2.3 | 6.0 | 1.0 | 4.6 | 5.6 | 1.7 | 2.3 |
While nothing stands out individually, what does is how both players seemed to live just on the fringe of each statistical category of the archetypes. So Green and Hill deserve a spot on the list, having played nearly double the games required and, well, being extremely valuable to their squads. So, we have our guards to choose from:
- Mike Conley
- Tony Allen
- Wesley Matthews
- J.J. Redick
- J.R. Smith
- George Hill
- Thabo Sefolosha
- Danny Green
Now, we needs some forwards to pair with them. I’ll be looking at standard forwards as well as prototypical centers for this category, as the “stretch-four” forward has been very common in this era. That archetypes for this are two-way threats like Paul George and Kawhi Leonard as well as powerful big men like Anthony Davis and Dwight Howard. Then, obviously, is LeBron James, who embodied the position-less concept by at times being the floor general and top scoring threat.
A forward’s primary goal, as it has been since the game’s inception, is to score. A million years ago, guards merely moved around and fed the ball inside to a forward or kicked it out to a wing player for a 12-foot jump shot. Now, in the future, centers shoot three pointers and then crash the boards. The objective is to score the points, though, so let’s start there for the forwards.
| Crit | Crit | Crit | Shoo | Shoo | Shoo | Shoo | Shoo | Shoo | ||||
|---|---|---|---|---|---|---|---|---|---|---|---|---|
| Rk | Player | From | To | G | PTS ▼ |
PTS | FG% | 2P% | 3P% | eFG% | FT% | TS% |
| 1 | Al Jefferson | 2010 | 2018 | 584 | 28.4 | 16.1 | .496 | .498 | .163 | .497 | .722 | .522 |
| 2 | Michael Beasley | 2010 | 2019 | 528 | 27.7 | 12.2 | .464 | .482 | .342 | .486 | .757 | .518 |
| 3 | Carlos Boozer | 2010 | 2015 | 429 | 27.4 | 15.6 | .506 | .506 | .000 | .506 | .719 | .536 |
| 4 | Enes Kanter | 2012 | 2019 | 583 | 27.2 | 11.9 | .541 | .548 | .294 | .545 | .780 | .584 |
| 5 | Andrea Bargnani | 2010 | 2016 | 329 | 27.1 | 15.6 | .447 | .479 | .334 | .484 | .820 | .528 |
| 6 | Marreese Speights | 2010 | 2018 | 626 | 27.0 | 8.0 | .454 | .471 | .358 | .481 | .800 | .526 |
| 7 | Rudy Gay | 2010 | 2019 | 641 | 26.9 | 17.9 | .458 | .485 | .346 | .492 | .806 | .538 |
| 8 | Charlie Villanueva | 2010 | 2016 | 382 | 26.4 | 8.2 | .417 | .478 | .348 | .499 | .741 | .518 |
| 9 | Hassan Whiteside | 2011 | 2019 | 343 | 26.0 | 13.4 | .574 | .576 | .222 | .575 | .593 | .589 |
| 10 | Danilo Gallinari | 2010 | 2019 | 521 | 25.6 | 16.4 | .425 | .464 | .374 | .507 | .870 | .588 |
| 11 | Tobias Harris | 2012 | 2019 | 546 | 25.4 | 15.4 | .471 | .512 | .364 | .521 | .822 | .562 |
| 12 | Ryan Anderson | 2010 | 2019 | 581 | 25.0 | 12.9 | .424 | .474 | .381 | .526 | .854 | .563 |
| 13 | Carl Landry | 2010 | 2016 | 402 | 25.0 | 11.3 | .525 | .526 | .308 | .526 | .791 | .586 |
Sorting by players who scored at least 25 points per 100P, we get a class of 13, featuring some names I’d bet you haven’t thought about in a while. Al Jefferson is the leader in that regard. Not shown here for space saving purposes is how he took the most shots per game, with 25 (!!!). Still, if his objective is to score, it makes sense that he’s on the roster. Hassan Whiteside, on the other hand, is at the top of every percentage rank besides free throws, a particular sore spot for big men.
The most insane thing I learned in doing this project is that Rudy Gobert has not been an All-Star. Is there no justice? I could toss him on to the list of forwards without explanation but okay here I’ll go ahead. Here is a comparative list for his career to date.

Similarity to everyone on that list is what you’d want in a career. If that’s not enough, how about his Basketball Reference badge set.
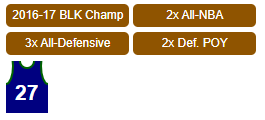
Gobert is on track for the Hall of Fame, and he might just achieve it without an All-Star bid. There are just so many great forwards in the game today. I need to move on, but yes, Gobert is in our finalist group.
Defense, particularly in the paint is vital to a forward’s statistical health. How good is a guy at blocks and boards? That’s an easy indication for traditional centers.
Enter: Serge Ibaka, the once-heralded fourth wheel of Oklahoma City’s Big Three. Now, he’s the only one with a title that did not come after joining a 73-win rival.
| Crit | Crit | Crit | Per | Shoo | Shoo | |||||
|---|---|---|---|---|---|---|---|---|---|---|
| Rk | Player | From | To | G | BLK | BLK | GS | MP | FG% | TS% |
| 1 | Serge Ibaka | 2010 | 2019 | 753 | 2.2 | 1626 | 619 | 28.7 | .514 | .570 |
| 3 | Rudy Gobert | 2014 | 2019 | 406 | 2.2 | 895 | 314 | 28.7 | .629 | .650 |
Only 2 forwards played at least 350 games in the ’10s and averaged 2.2 blocks per game. Previously noted Rudy Gobert, and Serge. He was the Rock of Gibraltar, a level of consistency that just seems stupid in totality. In fact, of the seven players with at least 1,000 blocks, Serge ranks ahead of them all, and he is also the lone player without an All-Star appearance.
| Crit | Crit | Per | ||||
|---|---|---|---|---|---|---|
| Rk | Player | From | To | G | BLK | BLK |
| 1 | Serge Ibaka | 2010 | 2019 | 753 | 1626 | 2.2 |
| 2 | DeAndre Jordan | 2010 | 2019 | 766 | 1291 | 1.7 |
| 3 | Dwight Howard | 2010 | 2019 | 637 | 1237 | 1.9 |
| 4 | Anthony Davis | 2013 | 2019 | 466 | 1121 | 2.4 |
| 5 | Brook Lopez | 2010 | 2019 | 635 | 1098 | 1.7 |
| 6 | Roy Hibbert | 2010 | 2017 | 592 | 1070 | 1.8 |
| 7 | Marc Gasol | 2010 | 2019 | 713 | 1068 | 1.5 |
One of the names I did not expect to come up in this is Marcin Gortat, but lets look at the table.
| Crit | Crit | Tota | Tota | Tota | Tota | Tota | ||||||
|---|---|---|---|---|---|---|---|---|---|---|---|---|
| Rk | Player | From | To | Tm | Lg | TRB | TRB% | G | ORB | DRB | BLK ▼ |
TOV |
| 1 | DeAndre Jordan | 2010 | 2019 | TOT | NBA | 8653 | 21.7 | 766 | 2588 | 6065 | 1291 | 1094 |
| 2 | Dwight Howard | 2010 | 2019 | TOT | NBA | 8077 | 21.2 | 637 | 2198 | 5879 | 1237 | 1857 |
| 3 | Pau Gasol | 2010 | 2019 | TOT | NBA | 6218 | 17.0 | 642 | 1562 | 4656 | 941 | 1199 |
| 4 | Andre Drummond | 2013 | 2019 | DET | NBA | 7424 | 24.4 | 542 | 2608 | 4816 | 845 | 969 |
| 5 | Marcin Gortat | 2010 | 2019 | TOT | NBA | 6105 | 17.4 | 737 | 1655 | 4450 | 831 | 931 |
| 6 | LaMarcus Aldridge | 2010 | 2019 | TOT | NBA | 6473 | 14.3 | 730 | 1983 | 4490 | 780 | 1208 |
| 7 | DeMarcus Cousins | 2011 | 2019 | TOT | NBA | 6131 | 18.9 | 565 | 1565 | 4566 | 697 | 2000 |
| 8 | Kevin Love | 2010 | 2019 | TOT | NBA | 6663 | 19.6 | 576 | 1644 | 5019 | 253 | 1153 |
| 9 | Zach Randolph | 2010 | 2018 | TOT | NBA | 6009 | 18.0 | 610 | 1992 | 4017 | 164 | 1174 |
Of forwards with at least 6,000 rebounds, only 5 also had at least 800 blocks in the decade. Add in also having the fewest turnovers in the group, and you might see what I see in Gortat. He is the lone non-All-Star on that table, with many of the others having logged several appearances.
So I feel comfortable in saying that I have six forwards who fit the bill.
- Al Jefferson
- Hassan Whiteside
- Michael Beasley
- Rudy Gobert
- Serge Ibaka
- Marcin Gortat
So now after all of that nonsense, I give you the Fancy Boys Club TEAM OF THE DECADE, NO ALL-STARS ALLOWED…
FIRST TEAM
- Mike Conley
- J.J. Redick
- Rudy Gobert
- Serge Ibaka
- Al Jefferson
SECOND TEAM
- Tony Allen
- Thabo Sefolosha
- Michael Beasley
- Hassan Whiteside
- Marcin Gortat
So, I guess I’ll just sit back and let you tell me how right I am.
